What is going on inside the reactors remains totally unknown.
It is almost a year (this was written on Feb. 23) since the great earthquake hit the Tohoku region of Japan on March 11, 2011. However, little is known about the current situation inside each of the reactors at the Fukushima Daiichi Nuclear Power Station.
Questions about the reactors that remain unanswered include;
- What damage did the quake cause, and did this lead to a leakage of radiation?
- How many times did tsunami waves hit the nuclear power plant and how far did seawater penetrate into the plant?
- Why did station blackout (loss of external power sources and emergency power sources) occur?
- To what extent are parameters related to the operation of nuclear reactors reliable, including the water-level gauges?
- When did the core meltdown begin?
- Did the containment vessel venting system function properly?
- How did the hydrogen explosions in Units 1 and 3 occur, and what caused the difference between the two explosions?
- How was the containment vessel of Unit 2 damaged? (Did it explode?)
- What caused the fire or explosion in Unit 4?
- How much radiation was released during each of the events (or at what time)?
- What is the current status of the molten fuel, the pressure vessels and the containment vessels?
On December 2, 2011, Tokyo Electric Power Company (TEPCO) released the interim report of the Fukushima Nuclear Accidents Investigation Committee (http://www.TEPCO.co.jp/en/press/corp-com/release/betu11_e/images/111202e14.pdf). The report said that no earthquake damage was found in the facilities that are considered to be important from the viewpoint of safety. But that is not the case. There still remain a large number of facilities that have yet to be checked, including the inside of the nuclear reactor buildings. In addition, various data collected while the reactors were in operation strongly indicate that piping in the reactor buildings was damaged.
At the present stage, even if a camera could be put inside a nuclear reactor, it would be extremely difficult to see everything inside, including the condition of the nuclear fuel. The development of a device that enables checking of the condition of nuclear fuel under extremely high radiation levels is contradictory to the construction of a completely isolated and radiation-proof device, because excluding radiation would also mean excluding light. It is also doubtful that such a device would make it possible for us to take a close look at the inside of the containment vessels.
In fact, an attempt was made on January 19 to insert an industrial-use radiation-proof endoscope into the containment vessel of Unit 2 to check the inside of the vessel. However, hardly any important information could be obtained about the condition of the melted fuel.
Questionable accuracy and credibility of TEPCO’s MAAP analysis
TEPCO has made an analysis of the condition of the cores of Units 1, 2 and 3 using a computer program called Modular Accident Analysis Program (MAAP), developed by the U.S. Nuclear Regulatory Commission. However, it seems that the result of the analysis does not reflect reality at all.
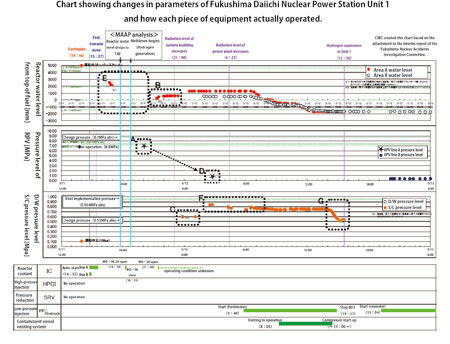
As an example, an attachment to TEPCO’s interim report (attachment 10-1 of Japanese report) includes a chart that shows the changes in the Unit 1 data. The chart revealed a contradiction between the result of the MAAP analysis and the collected data. Although the chart is rather big, we will use this chart because it contains a wide range of data and is therefore convenient for explaining the contradiction [see next page]. The chart includes three graphs. The top graph shows changes in the reactor water level, the second shows pressure level, and the third is a graph of the drywell (D/W) and the suppression chamber (S/C) in the containment vessel. Below the graphs is a chart that describes how each piece of equipment was operated from 12:00 on March 11 through 24:00 on March 12. The horizontal axis of the chart indicates time.
Each of the three graphs has two pale blue lines at 18:00 and 19:00 on March 11 respectively. These lines show the result of the MAAP analysis. The analysis indicates that reactor water level dropped to the top of the fuel rods at 18:00, and that the fuel rods became exposed to the air and began to melt at 19:00.
While there are only few data for the water-level measurement in the “E” area, which is surrounded by a dotted line in the reactor water level chart, it would be safe to conclude from the actual data measured with the water level gauge that there was enough water in the reactor to fully cover the fuel rods. The data measured afterwards also show that the water level did not drop to the top of the fuel rods. This means that there is a significant gap between the result of the MAAP analysis and the actual data. TEPCO insists that the water-level gauge was broken at the time and was not able to take accurate measurements. However, there is no evidence to prove that the gauge was broken at the time. Moreover, the MAAP analysis was made based on the assumption that the main safety relief valves (described as SRVs in the analysis) were operated frequently, although there are no records that prove the use or operation of the valves. TEPCO’s explanation totally lacks credibility and persuasiveness. It seems that TEPCO carried out the MAAP analysis on the basis of such a questionable assumption because it wanted to prove that a core meltdown could occur even though there was no damage to the plant’s piping. It is, however, extremely doubtful that the result of such an analysis correctly reflected what actually happened in the reactor.
Did the temperature in Unit 2 rise?
The temperature in the reactor pressure vessel (RPV) of Unit 2 began rising on February 2, 2012. It exceeded 90oC on February 13 and continued to rise sharply. According to the charts released by TEPCO, one of thermocouple-type thermometers read more than 400oC. TEPCO increased the amount of water injected into the RPV to 17.5 tons. As the company increased the amount of water, it also added boric acid to the water in order to prevent recriticality.
The thermometer that showed the high temperature was installed at 0o in a circumferential direction on the upper part of the bottom head of the RPV. However, another thermometer nearby indicated a temperature decline of 40oC to 30oC. That is why TEPCO has concluded that one of the thermometers in the RPV registered such a high temperature not because the temperature in the RPV actually rose to that level, but because the thermometer did not work due to disconnection or some other reason.
But there is the possibility that molten nuclear fuel moved closer to the thermometer for some reason (operation by staff, earthquake or collapse) and caused the temperature to rise around the thermometer. Another possibility is that there was an active nuclear reaction locally, resulting in the higher temperature. Even if the thermometer was truly broken, we still need to know what caused the breakdown, why such an accident happened at that time, and whether or not other thermometers in the RPV were working normally.
TEPCO’s explanation about the extremely high temperature indicated the possible loss of just one thermometer in the RPV, but if we consider the future situation of the RPV, this may be a quite serious problem. Should the loss of measuring instruments continue, it will become more difficult, and eventually totally impossible, to know what is going on inside the reactor. Such a situation would not only make it harder for us to determine how to deal with the molten nuclear fuel, but also make the process of cooling the molten fuel even more unstable. This may lead to a further release of radiation from the reactor.
Chihiro Kamisawa (CNIC)
Return to CNIC's Earthquakes and Nuclear Power page
Return to CNIC's Radiation Exposure page

