Reference Material: Statistics Related to the Fukushima Daiichi Nuclear Power Station Accident
By Matsukubo Hajime (CNIC)
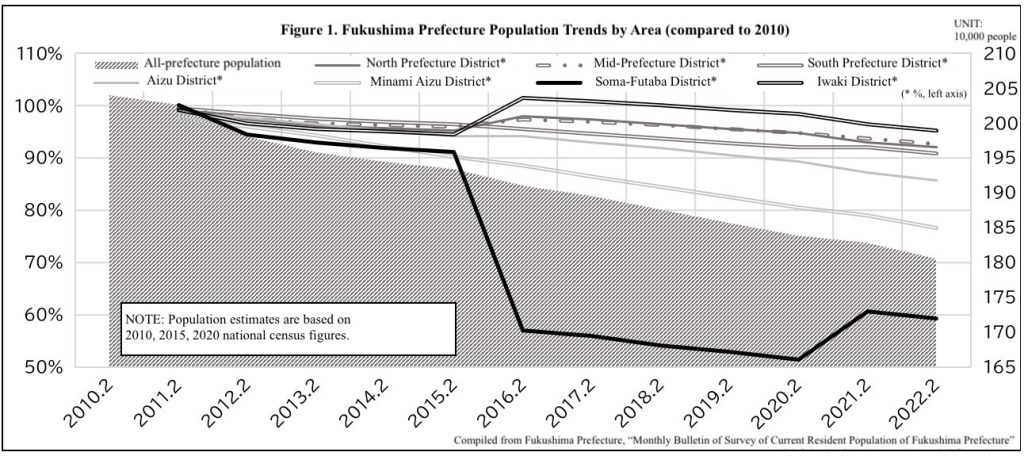
Here, we summarize statistics related to the Fukushima Daiichi Nuclear Power Station accident. In the Fukushima Prefecture Population Trends by Area (Fig.1) the population decline in the Soma-Futaba district is especially noticeable, but as these figures are based on resident registration records the real decline may be considerably larger (Table 1).
The trend regarding evacuee numbers from Fukushima Prefecture related to the Great East Japan Earthquake has been extracted from a summary compiled by the Reconstruction Agency (Fig.2). Since in these statistics evacuees were not counted as such after the cut-off of support, the actual number of evacuees is thought to be much larger than shown here.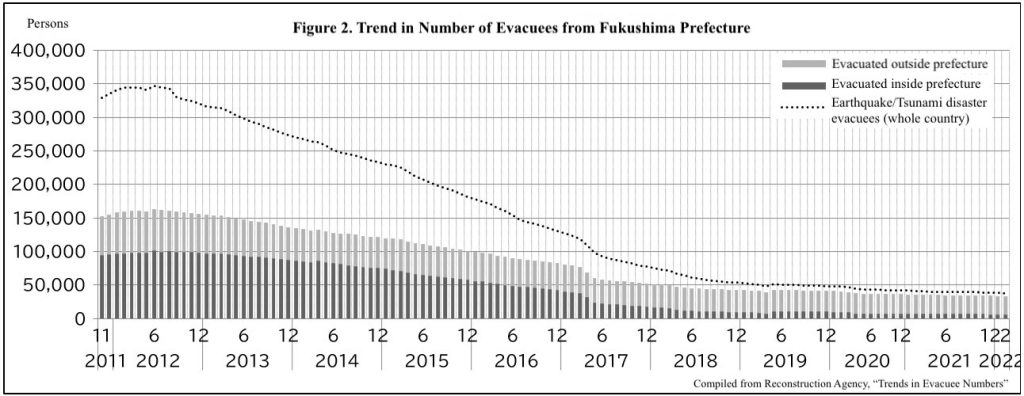
The trend in numbers of elementary and junior high school students who evacuated due to the nuclear accident is indicated for each of the municipalities in Fig.3. Numbers in Hirono Town are showing a rising trend, and the opening of Futaba Mirai Gakuen (Future Campus) Junior High School in 2019 has accelerated this trend.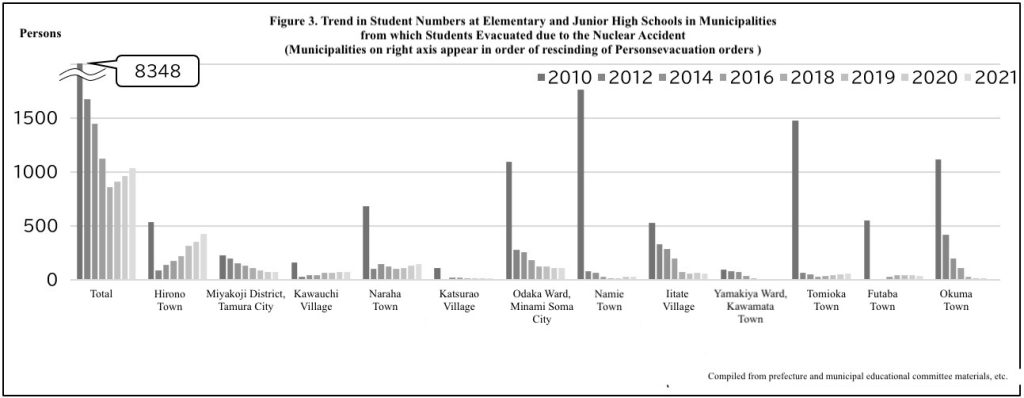
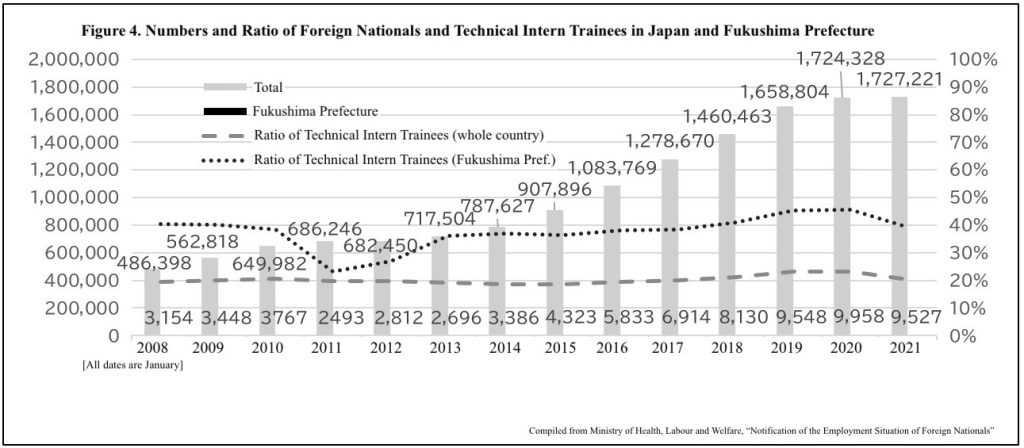
Fig.4 shows the population and ratio of foreign nationals and technical intern trainees in Japan. Following the accident, the numbers temporarily declined in Fukushima Prefecture, but greatly increased later.
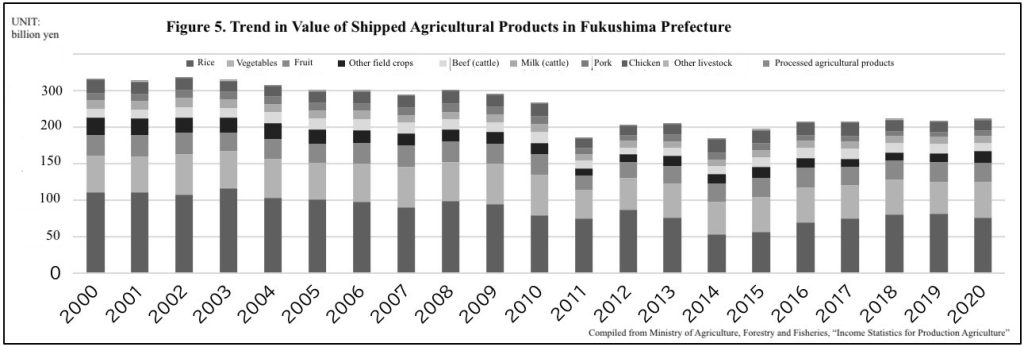
Figure 5 shows the trend in the value of agricultural products shipped from Fukushima Prefecture. Before the accident the shipped value was around 250 billion yen annually, but was 185.1 billion yen in 2011 and has remained stagnated at around 200 billion yen (211.6 billion yen in 2020) since that time.
