Survey of the Concentration of Radioactive Cesium in Urine by Germanium Semiconductor Detector and Lifestyle Questionnaire Analysis (2013 to end of 2023)
By Tanimura Nobuko
Introduction
Radioactive contamination of the environment resulting from the Tokyo Electric Power Company Fukushima Daiichi Nuclear Power Station accident has led to exposure risks for residents. Fukushima Prefecture is conducting whole body counter internal exposure measurements, but almost all the results are below the detection limit and this is being used as grounds for denial of internal exposure in residents. However, as the detection limit of the whole body counter being used for the measurements is high, it has been pointed out that there is a possibility that low-dose internal exposure is not being detected.
To meet calls from many residents demanding internal exposure surveys using a higher detection sensitivity, the NPO Shinjuku Yoyogi Citizen Monitoring Center has accumulated data by taking careful measurements of the concentration of radioactive cesium in the urine of residents throughout Japan, including residents of Fukushima Prefecture. More than 2100 urine samples have been tested.
Jointly with the Monitoring Center, the Citizens’ Nuclear Information Center (CNIC) has published a report (full report in Japanese only) assessing the impact on radioactive cesium concentration in urine due to differences in residential area and lifestyle. This article provides an outline of the report.
Survey Method
Urine Donor Attributes
Female donors were 55% and male donors were 45% of the total. Age 10 and below were 49% of the total, ages 11 to 20 were 21%, ages 21-50 were 24%, and only 6% of donors were 51 or more years of age. Donors of 20 years and under thus comprised 70% of the total. This age distribution is due to the high percentage of children participating in “recuperation” and their parents.
The residential areas of the urine sample donors covered the entire area of Japan from Hokkaido to Okinawa, the largest number of donors being from Fukushima, accounting for 58% of the total, 25% from the Tokyo area (Tokyo, Kanagawa, Chiba, and Saitama), around 10% from prefectures adjacent to Fukushima Prefecture (Miyagi, Tochigi, Ibaraki, and Gunma), and 6% from other areas.
Differences in Cesium 137 Concentration of Urine due to Area
<Comparisons with the Whole of Japan>
The distribution of cesium 137 concentration in urine was assessed by dividing residential areas into the four areas of 1. Fukushima Prefecture, 2. prefectures adjacent to Fukushima Prefecture (Miyagi, Tochigi, Ibaraki, and Gunma), 3. the Tokyo area (Tokyo, Kanagawa, Chiba, and Saitama), and 4. other areas. (Fig. 1)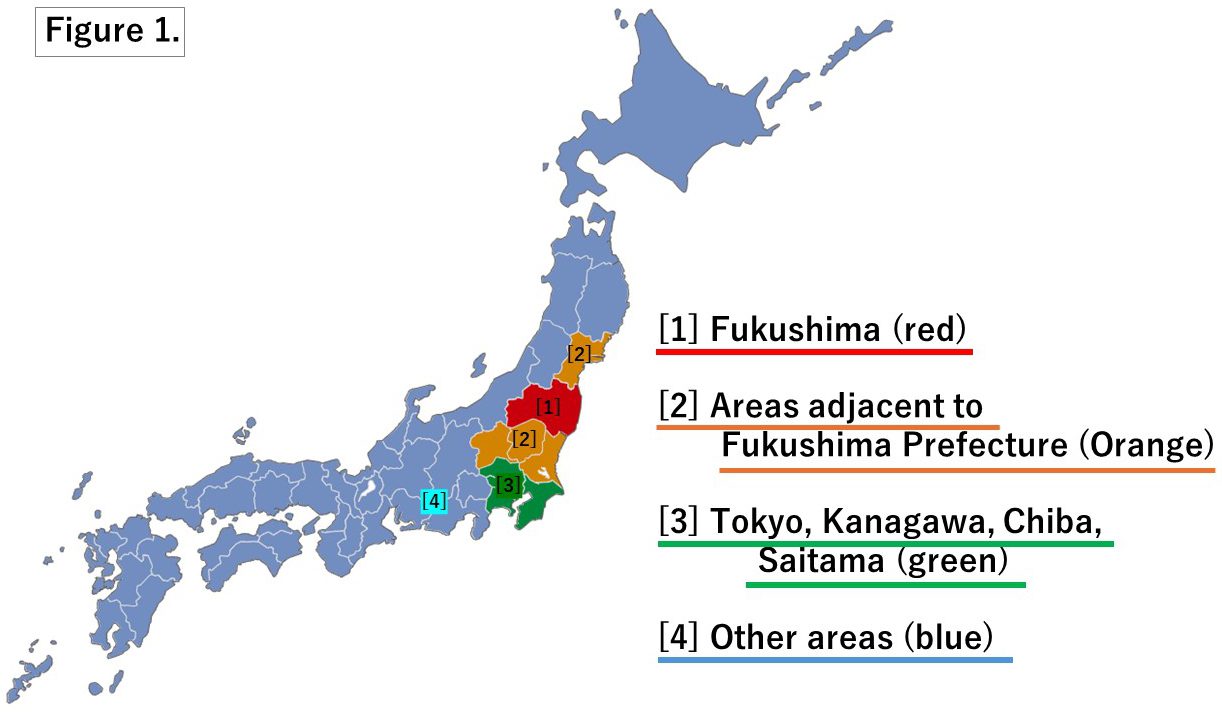
As a result, the concentration distribution in areas 1 (Fukushima Prefecture) and 2 (prefectures adjacent to Fukushima Prefecture) tended to be very similar, showing low non-detection rates and a most frequent concentration of 0.05 up to 0.10 Bq/kg. It was found that the detection frequency of higher concentrations was higher than in other areas. The non-detection rate in area 3 (the Tokyo area) was around 40% and in area 4 (other areas) around 45%. In other areas, the non-detection rate was seen to fall as the concentration rose (Fig. 2 and 3). 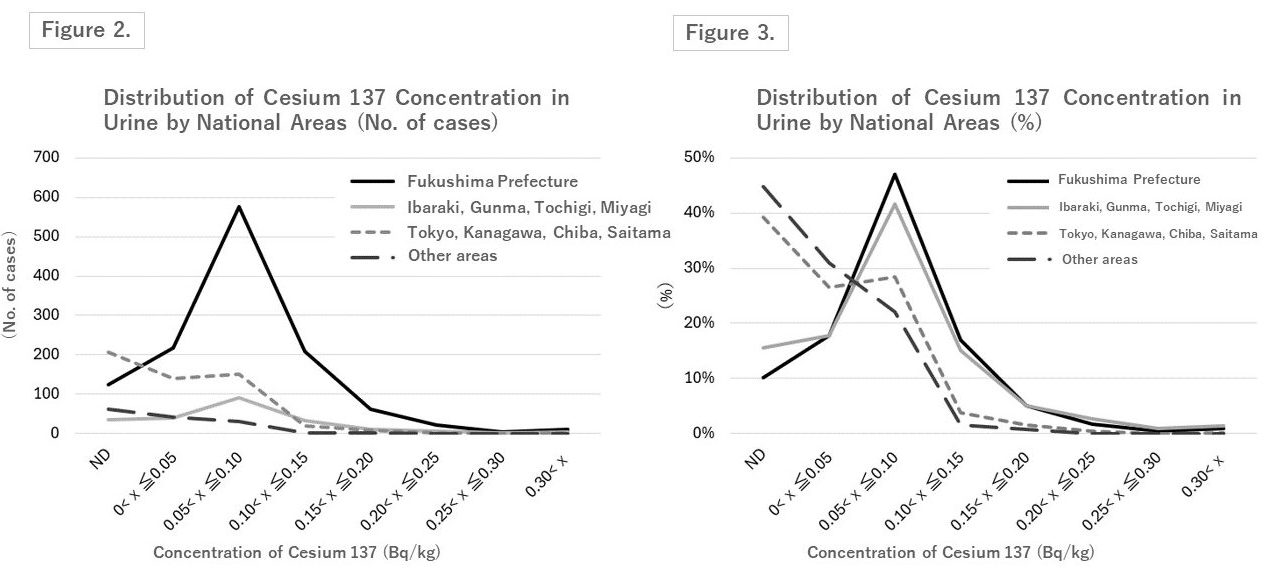 While only the exposure problem in Fukushima Prefecture is spotlighted, it can be said from these test results that residents in adjacent prefectures also face an equivalent exposure risk.
<Comparisons within Fukushima Prefecture>
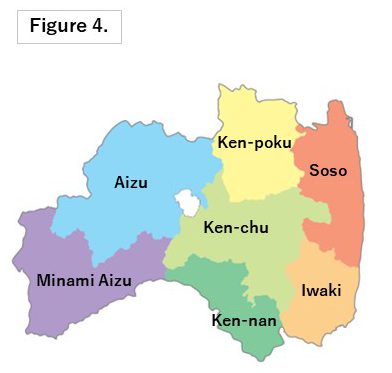 The concentrations of cesium 137 in urine samples were then examined by different areas within Fukushima Prefecture (Aizu, Minami Aizu, Ken-poku, Ken-chu, Ken-nan, Soso, and Iwaki) (Fig. 4).
Radioactive cesium was detected in more than 80% of the samples from all areas, with the Soso area having a 99% detection rate.
The concentration distribution for each of the Fukushima Prefecture areas is shown in the graphs (Figs. 5 and 6). 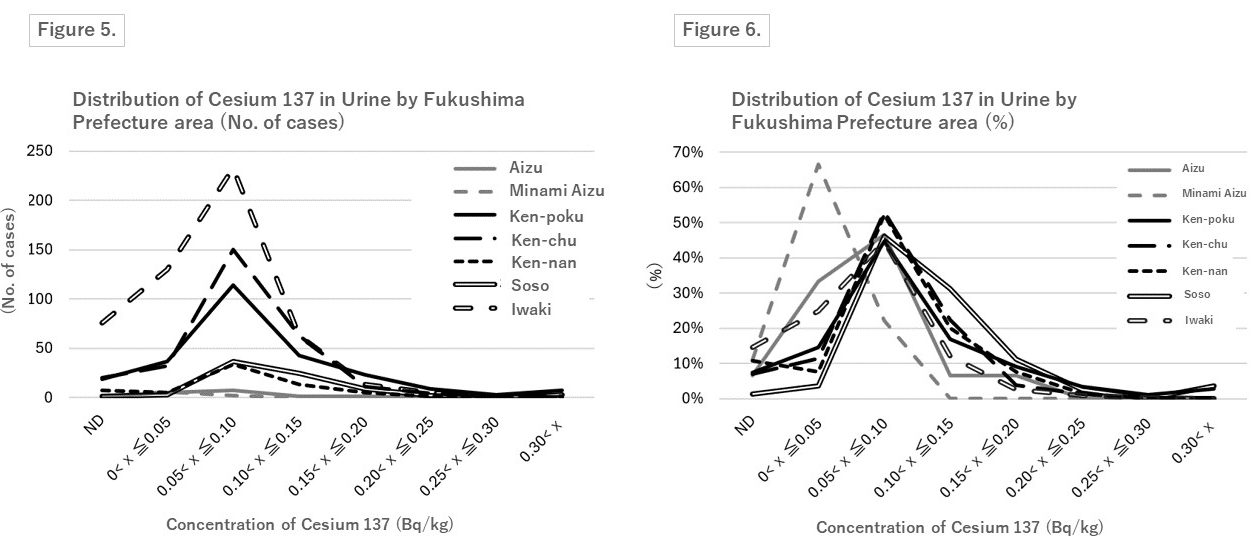 Minami Aizu tended to show the lowest concentrations. While in all other areas the most frequent concentration was 0.05 up to 0.10 Bq/kg, in Minami Aizu around 80% of samples tested lower that 0.05 Bq/kg. Aizu tended to have the next lowest concentrations. The Soso area showed high detection frequencies for high concentrations, the most frequent concentration rate being 0.05 up to 0.10 Bq/kg, but the rate of occurrence of higher concentrations was higher. Looking at Fig. 6, the shape of the curve bulges out to the right-hand side. The Ken-poku, Ken-chu, and Ken-nan areas showed concentrations somewhat lower than the Soso area. Almost the same trend can be seen there, but of these, samples from Ken-poku residents show the detection of slightly higher concentrations of cesium 137 in urine. The Iwaki area tended to be similar to the Aizu area.
Lifestyle Questionnaire Responses and Concentrations of Cesium in Urine
Concentrations of cesium 137 in urine differ among donors living in the same area. Lifestyle habits were examined to see if there were trends that might be causing these differences.
Responses (including questions with multiple responses) for each questionnaire item for the group for which no cesium was detected in urine (up to 0.04 Bq/kg) and the group which showed a concentration of 0.20 Bq/kg or more were compared. Taking note of differences in response rates for options chosen, the distribution of concentrations of cesium 137 in urine were checked against the donors for each of the options. A part of the results is introduced here.
A clearly dissimilar trend in concentration distribution was seen between those who responded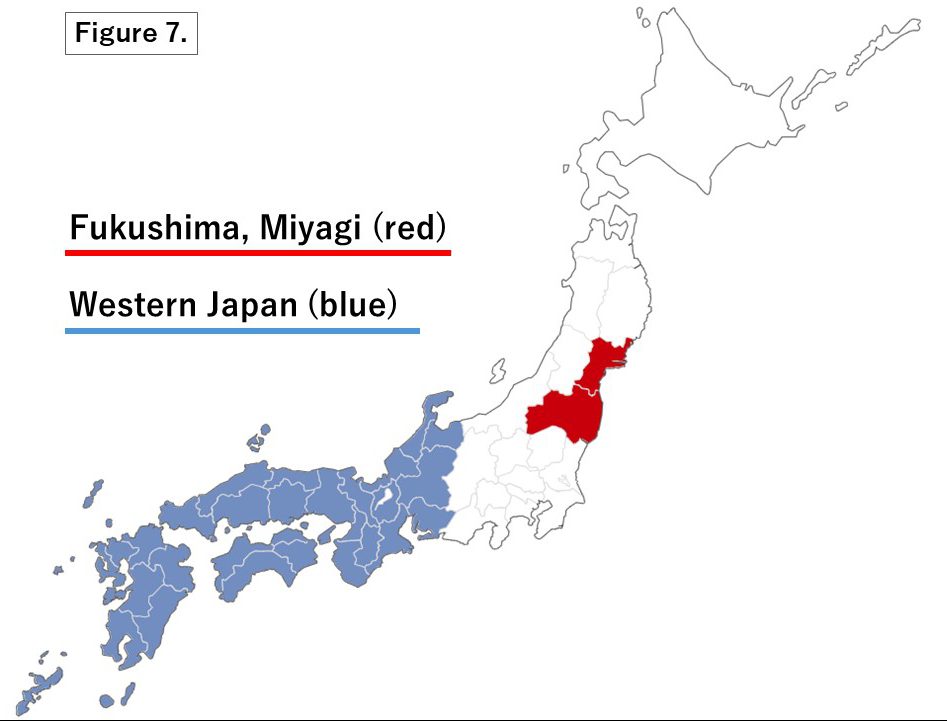 Fukushima and Miyagi as the production areas for rice and vegetables and those who responded Western Japan (Fig. 7).
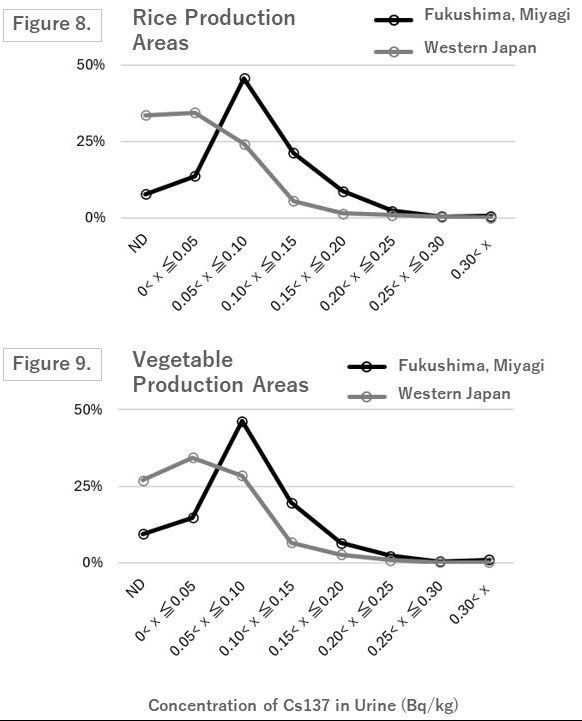 The concentration distribution for the former was skewed toward the higher end of the graph when compared with the latter. Non-detection rates were also lower for the former than the latter. (Figs. 8 and 9)
Regarding lifestyle differences, no impact on the concentration of cesium 137 in urine was seen in donors who did or did not grow their own vegetables, or for the place where they dried their laundry (e.g. indoors or outside).
Changes in Cesium Concentration in Urine due to Recuperation
After the Fukushima nuclear accident, the time children were allowed to play outside in Fukushima Prefecture and adjacent areas was reduced to avoid exposure. To redress this situation slightly, “recuperation” trips were implemented for children to stay temporarily in areas free from contamination, where they could enjoy playing outside as much as they liked in natural environments unsullied by radioactive substances. Changes in radioactive cesium were assessed by testing urine samples from the same individuals before and after the recuperation. Recuperation periods were from around five to 40 days, about half of them being ten days or less. The destinations of recuperation trips were varied and to locations both inside Japan and overseas.
Before the recuperation trips, the highest value for the concentration of cesium 137 in urine was 0.62, the average was 0.092, and the median value was 0.079, whereas after recuperation the highest value for concentration was 0.43, the average was 0.075, and the median was 0.071 (all Bq/kg). Reduction in cesium concentration was seen 69% of participants in the recuperation trips. The higher the cesium concentration was prior to the recuperation trips, the greater was the concentration change, but there were also examples of an increase in concentration among those whose pre-recuperation concentration was low. It was indicated that not only did the recuperation trips have a spiritually refreshing effect, they also had the effect of reducing the amount of radioactive cesium in the body.
It is clear from the urine measurement activities of the Citizen Monitoring Center that residents of the areas that have been polluted by radiation from the Fukushima nuclear accident face a higher internal exposure risk than residents of other areas.
