Fukushima Now Part 2: Current State of Post-Accident Operations at Fukushima Daiichi Nuclear Power Station (January to June 2017)
State of the Plant
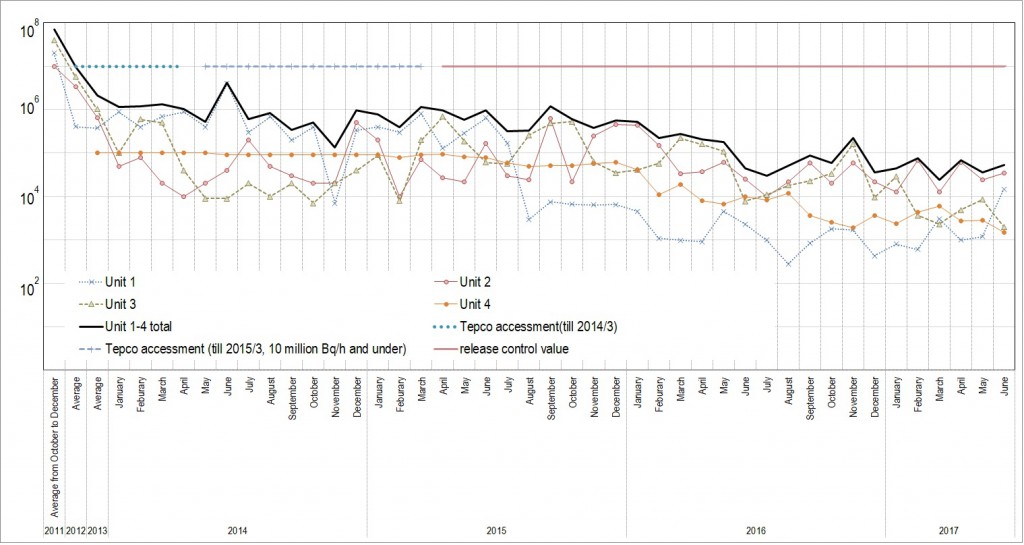
From the water temperature in the containment vessels and the spent fuel pools (SFPs), and from the state of releases of Xenon-135, released when uranium fuel undergoes fission, and other measurements, it can be estimated that the state of the reactors is stable. Further, according to an assessment by TEPCO, around 50,000 bequerels per hour (Bq/h) of radioactive materials were being released from the buildings in June.
Releases of radioactivity from Units 1 to 4 of Fukushima Daiichi Nuclear Power Station
(Ministry of Economy, Trade and Industry website)
The situation regarding the removal of spent fuel from the SFPs is summarized in Table 1. With the exception of Unit 4, from which spent fuel removal has been completed, all SFPs are currently undergoing pre-removal preparation work.
Surveys for molten debris were carried out for the interior of the reactor containment vessel between January 26 and February 16 for Unit 2 and between March 18 and April 6 for Unit 1. The muon tomography measurements already performed for Units 1 and 2 are being implemented for Unit 3 since May. Thus far the existence of a large amount of fuel debris has not been confirmed in the pressure vessel.
State of contaminated water
The government and TEPCO have formulated a mid- to long-term roadmap as a decommissioning plan for Fukushima Daiichi Nuclear Power Station (FDNPS). As contaminated water countermeasures, the current 2015 revision of the roadmap shows four areas requiring attention: removal, isolation, leakage prevention and completion of treatment of retained water.
While the changeover from flange-type tanks to welded tanks, which has been a problem for quite some time, is underway, of the current total capacity of the Unit 1-4 tanks, roughly 1.03 million m3, about 140,000 m3 is flange-type tanks.
As of June 2014, the assessed value of the dose at the site boundary had risen to 10.06 mSv/y due to radioactivity being released from the tanks and other sources, but this value had fallen to 0.93 mSv/y as of March 2017 due to countermeasures such as water treatment by ALPS and other methods, and by removing highly-radioactive contaminated materials from locations close to the site border.
An important factor in the increase in contaminated water was the influx (around 400m3/day) of groundwater into the buildings. To reduce this influx, waterproofing of the buildings, the use of a groundwater bypass to pump up upstream groundwater (currently around 200m3/day) and release it into the sea, the use of subdrains to pump up groundwater from locations close to the buildings (currently around 500m3/day), paving of the site with asphalt (93% of planned area of 1.45 million m2 completed), and the installation of a frozen earth barrier encircling Units 1-4 (on-land water barrier, total length roughly 1,500m) have been carried out. As a result, the influx of groundwater into the buildings was estimated at around 120-130 m3/day as of June. Since the release of contaminated groundwater to the sea has fallen, groundwater is being pumped up (around 140-150 m3/day) from groundwater drains and well points on the sea side. Previously, increases in the volumes of pumped up water were conspicuous after rainfall, but the fluctuations in pumped volumes has largely disappeared as a result of the countermeasures mentioned above. Pumped water volumes, however, have not fallen far enough to meet TEPCO’s original target of 70 m3/day.
The freezing of the frozen earth barrier is being implemented in three stages. Stage 1: Freezing of the entire length of the sea-side frozen earth barrier and the entire length of the mountain-side barrier with the exception of seven sections totaling 45m (sea-side barrier 690m, mountain-side barrier 860m), Stage 2: Freezing of the yet-unfrozen mountain-side barrier sections with the exception of one section, and Stage 3: Freezing of the entire length of the mountain-side barrier. 99% or more of the barrier has now reached a temperature of or lower than 0ºC, and permission to implement Stage 3 has been applied for. (Update: this was completed on August 22) However, according to assessments by TEPCO, while groundwater influx volumes on the mountain side in May were 580 m3/day, influxes into the buildings were 130 m3/day, volumes pumped up from the subdrains were 480 m3/day, and the volume released to the sea side was 110 m3/day. These volumes show that, despite being 99% frozen, the frozen earth barrier is having almost no effect at all.
(Hajime Matsukubo, CNIC)


